Markout and Insights
Use Insights to discover aggregate patterns, Markout report to locate decisions and tickets, and order records to reconstruct the event.
Markout report
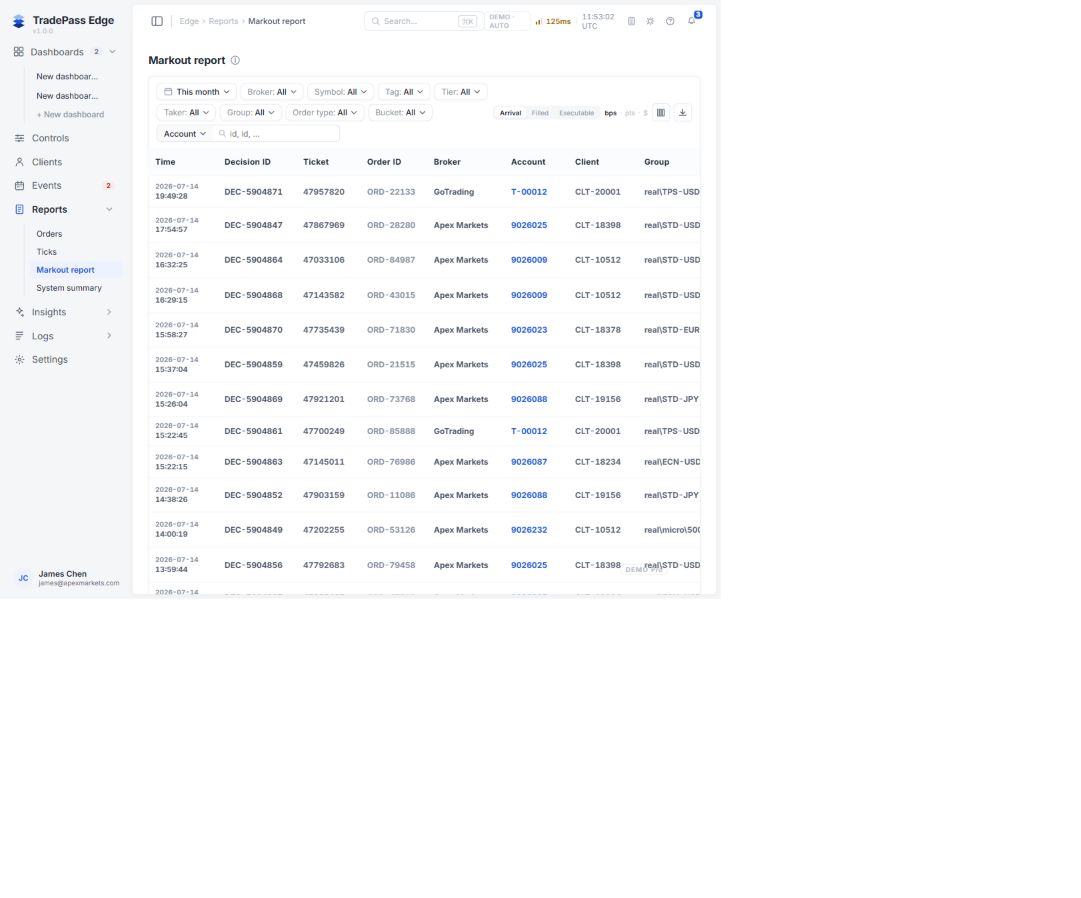
The report combines order identity and client context with pre- and post-trade windows. Always record the selected Arrival/Filled/Executable baseline and bps/pts/$ unit. Blank windows are missing values, not automatically zero.
Insights
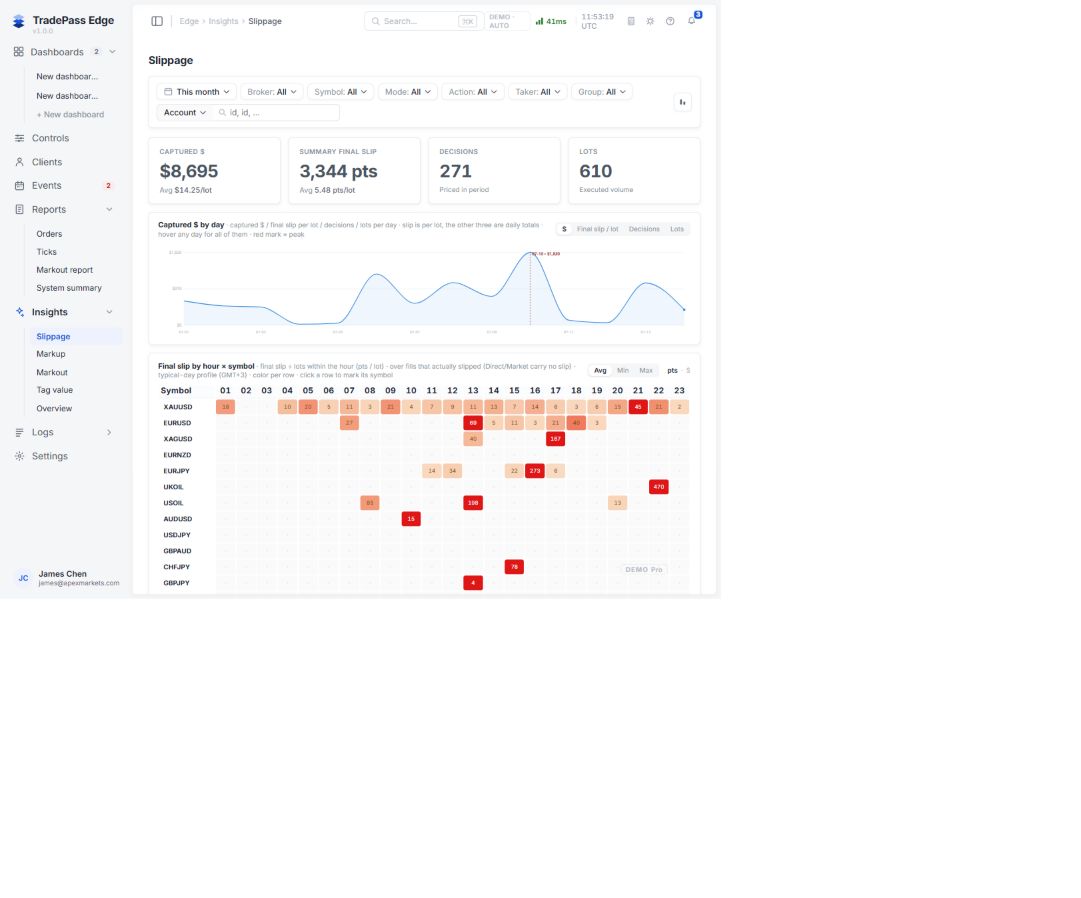
Insights includes Slippage, Markup, Markout, Tag value and Overview. Slippage supports views by day, hour and symbol, mode, formula dimension, tier, lot band, bucket and BFC bypass. Record filters, units, decisions and lots.
Formula-dimension splits are decomposition, not causality. Bucket rows overlap and must not be summed. The bucket view excludes hits ultimately routed STP or rejected; find those in Reports → Decision.
An aggregate outlier is a lead. Validate it by locating tickets in Markout report and reconstructing Decision, Execution and Ticks before drawing a conclusion.